Updates to the Active Investments View
Overview
Based on what we had been hearing from our end-users, my project team and I were curious if there was an opportunity for improvement of a key piece of The Gates Foundation's investment management system: the active investment view.
Initial Research & Ideation
User Interviews
I conducted six, 1-hour interviews with end-users across roles and departments. By asking, what works well, what does not work well, and what would they change I wanted to:
- validate and discover insights and requirements of managing active investments
- gain further clarity of how the investment app can better serve our customers
Things that I heard
- Primary activities are progress reporting and payment management
- Tab labels and the grouping of information within the tabs did not resonate with participants
- Jump links (anchor links used to navigate within the page) would be helpful
- The payments graph is not helpful
- There's no need to display material that was used to create the initial (in-process) investment
- As with the in-process workflow, it's not necessary to display the workflow steps
Next steps
After completing my analysis and presenting my findings, I began work on turning this output into concrete designs for review with my project team and stakeholders.
Based on what I heard
Based on what I heard from my interviews, I proposed specific solutions to address each major issue. After reviews and updates, I proposed the following designs.
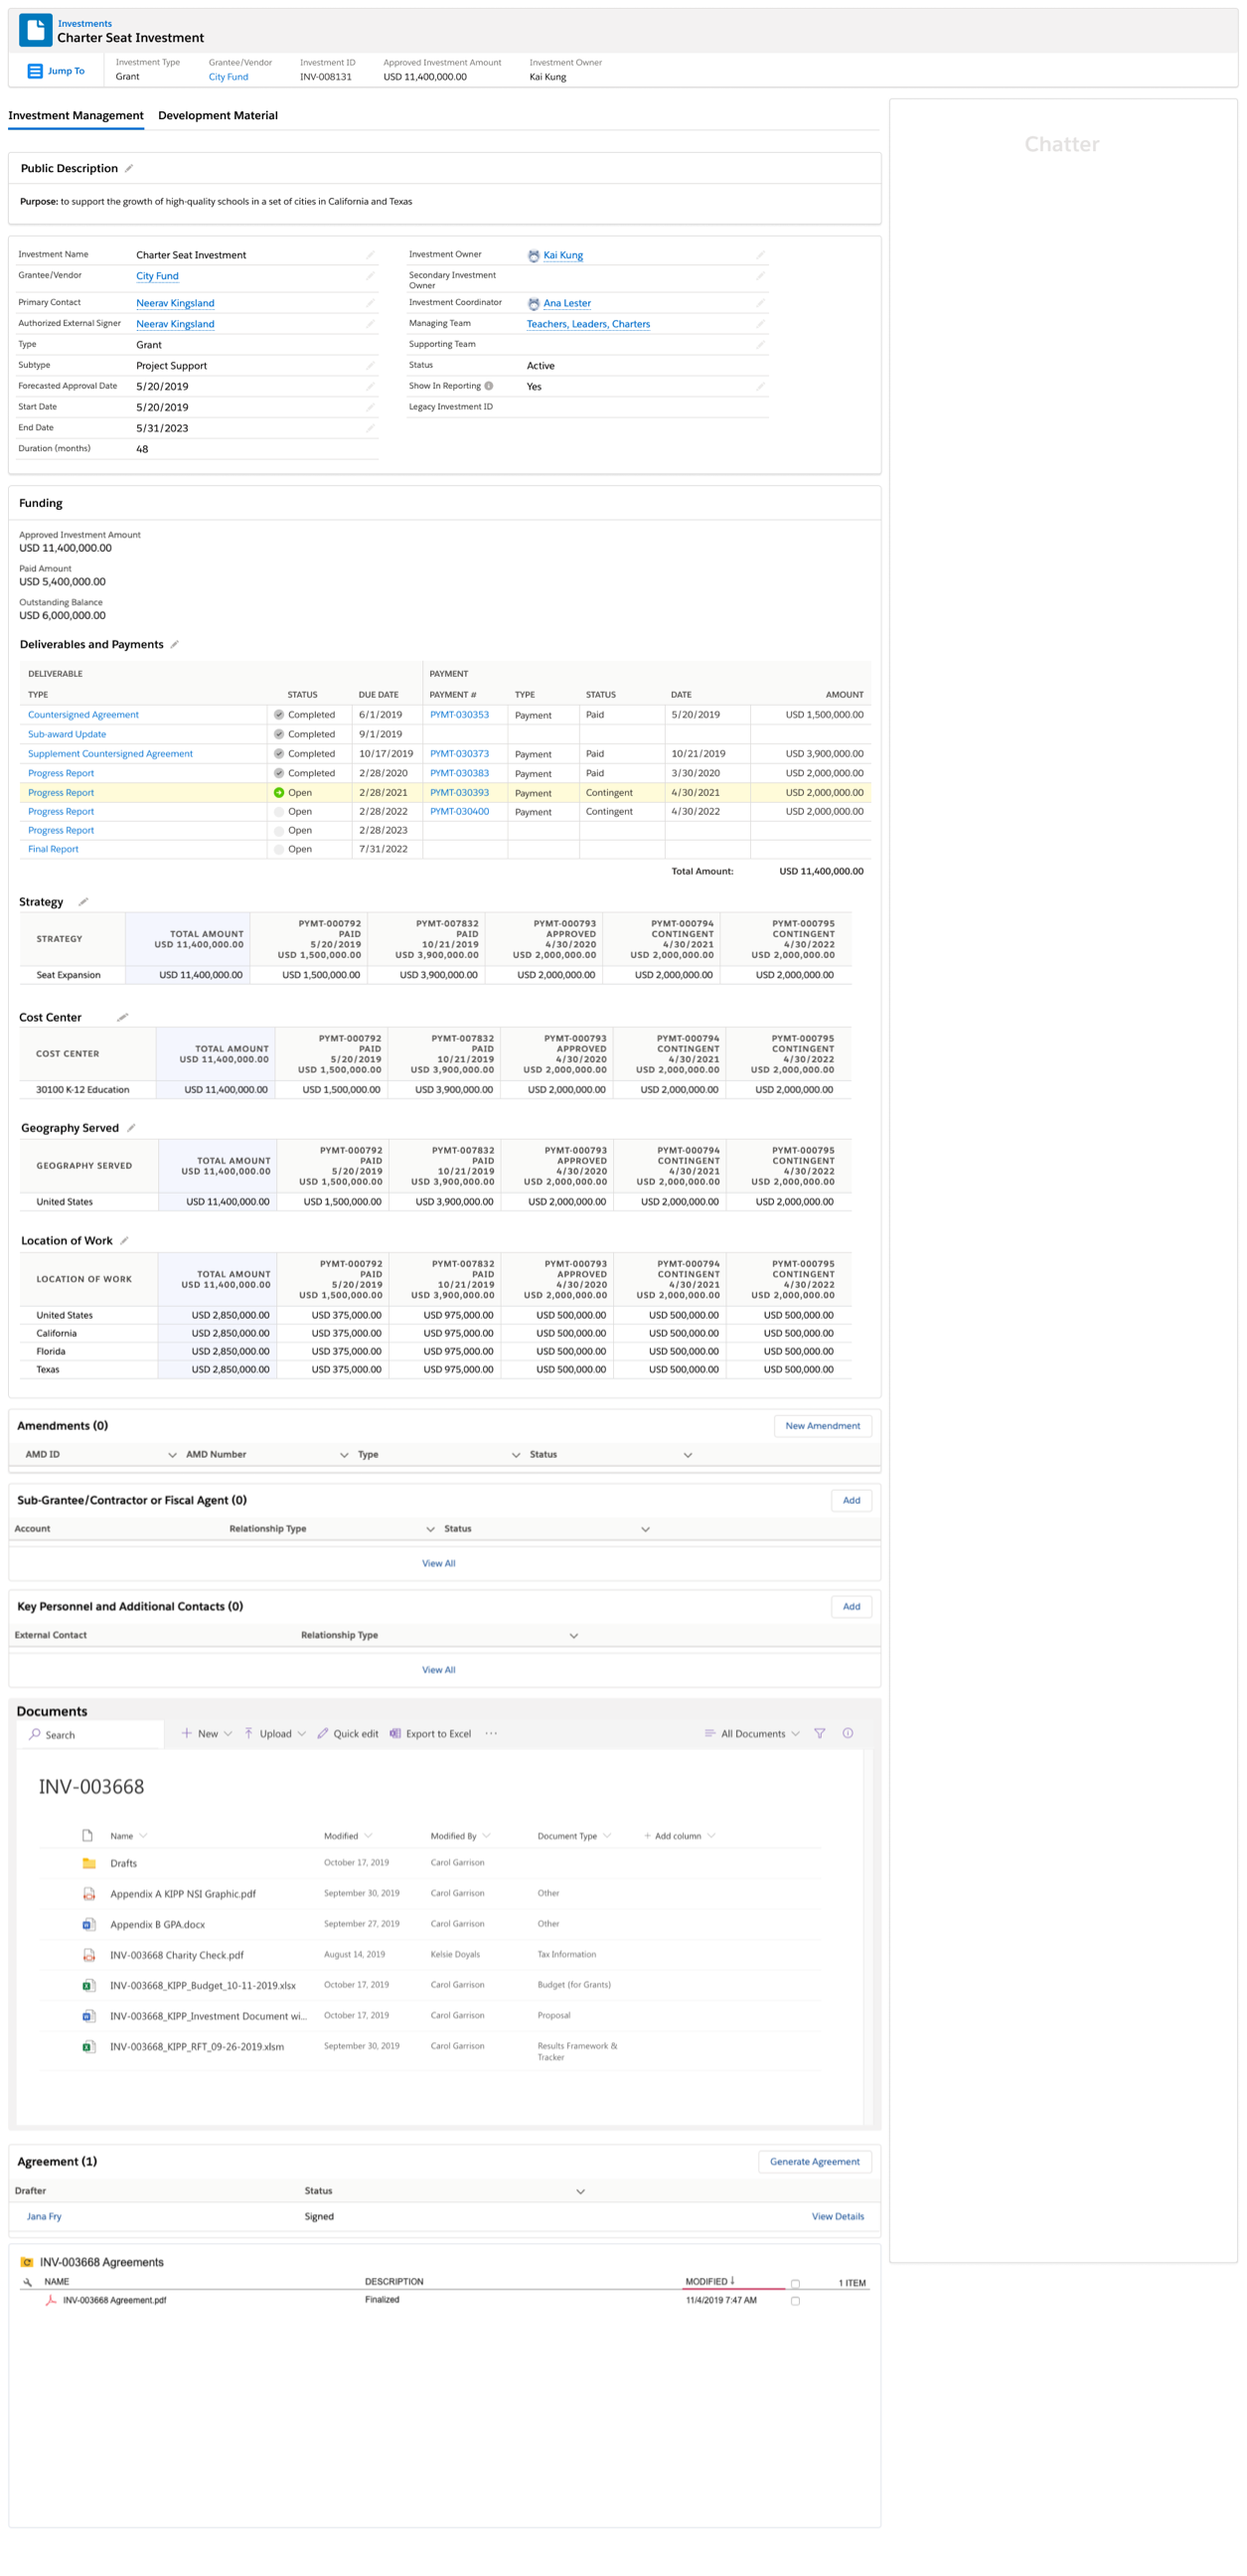
Primary activities are progress reporting and payment management
How this affects the experience
Customers are seeking out upcoming dates to ensure that they stay on top of reporting and payments.
Things I considered
- Look into ways the system can be more explicit in how it provides the dates of what’s upcoming
- Move deliverables/payments table to an even more prominent place in the UI
- Consider placing allocation funding closer to deliverables and payments
My proposed design
I added visual highlighting with color and icons to more explicity indicate which payments had been completed and which were still open.
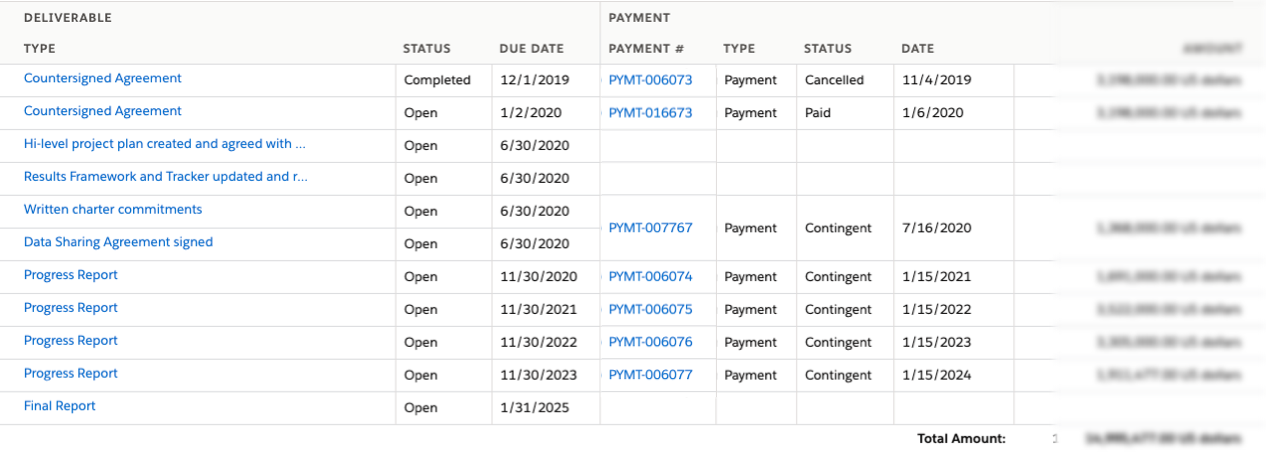
The original design
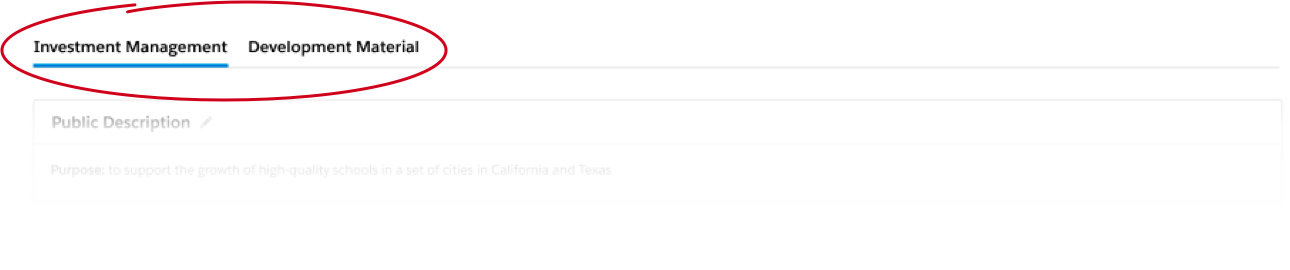
Tab labels and the grouping of information within the tabs did not resonate with participants.
How this affects the experience
- Could create uncertainty of where all info is located
- Increases the time it takes to locate that information
Things I considered
- Consider alternate labeling for the tabs
- Consider an alternate grouping and/or layout of the information
My proposed design
I updated the tab labels to something that I and my project team felt would resonate more closely with known business terminology used at the foundation.
The original design
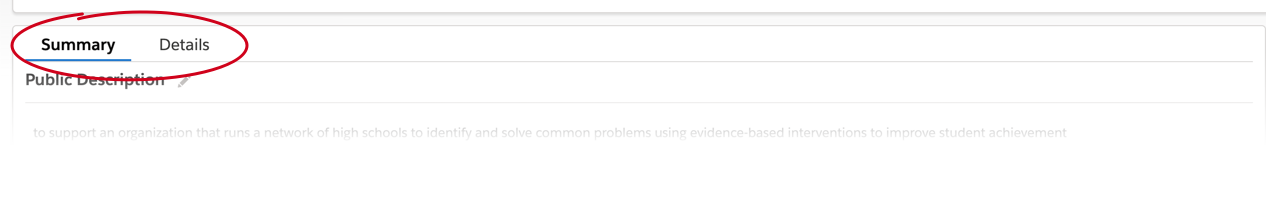
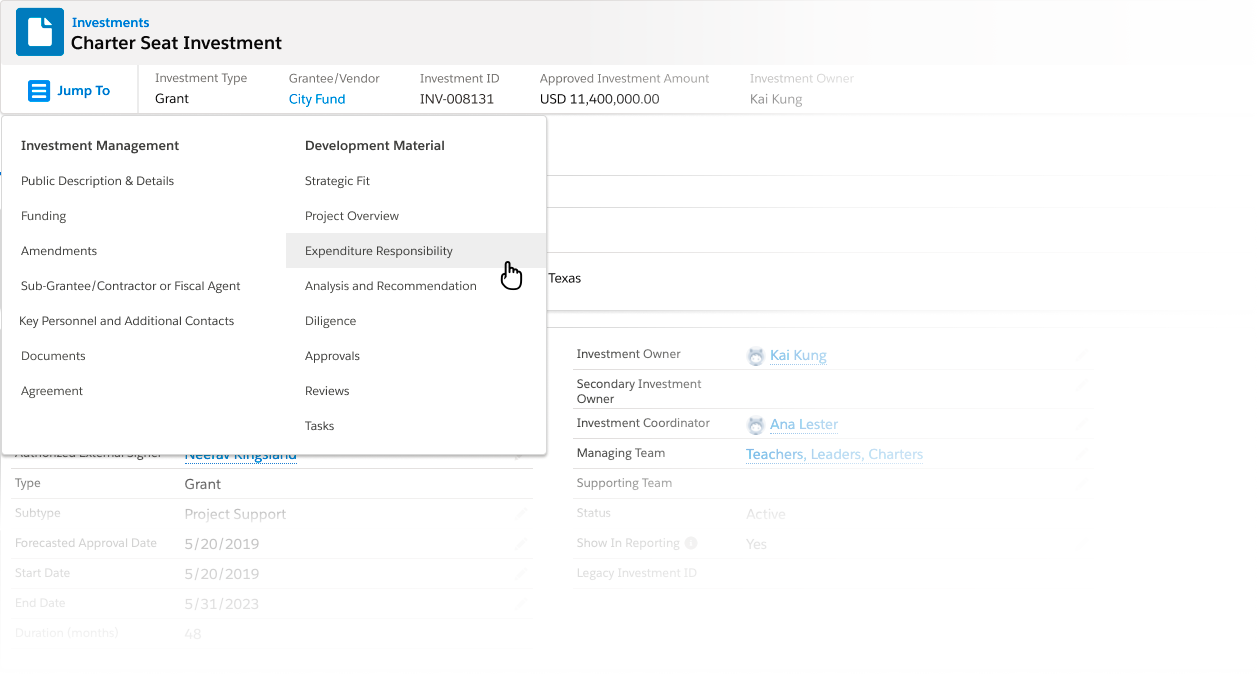
Jump links (anchor links used to navigate within the page) would be helpful.
How this affects the experience
- Could create uncertainty of where all info is located
- Increases the time it takes to locate that information
Things I considered
- Consider the implications of adding jump links
- Consider displaying everything on one page
My proposed design
I worked up a design with all the content on a single page but the amount of data that displayed was really overwhelming. So, after deciding to stick with tabs, I needed a page navigation solution that would accommodate linking across tabs. Out of a collaboration session came the idea of using a multi-column design. In this way, the items in each column mapped to the content within that tab.
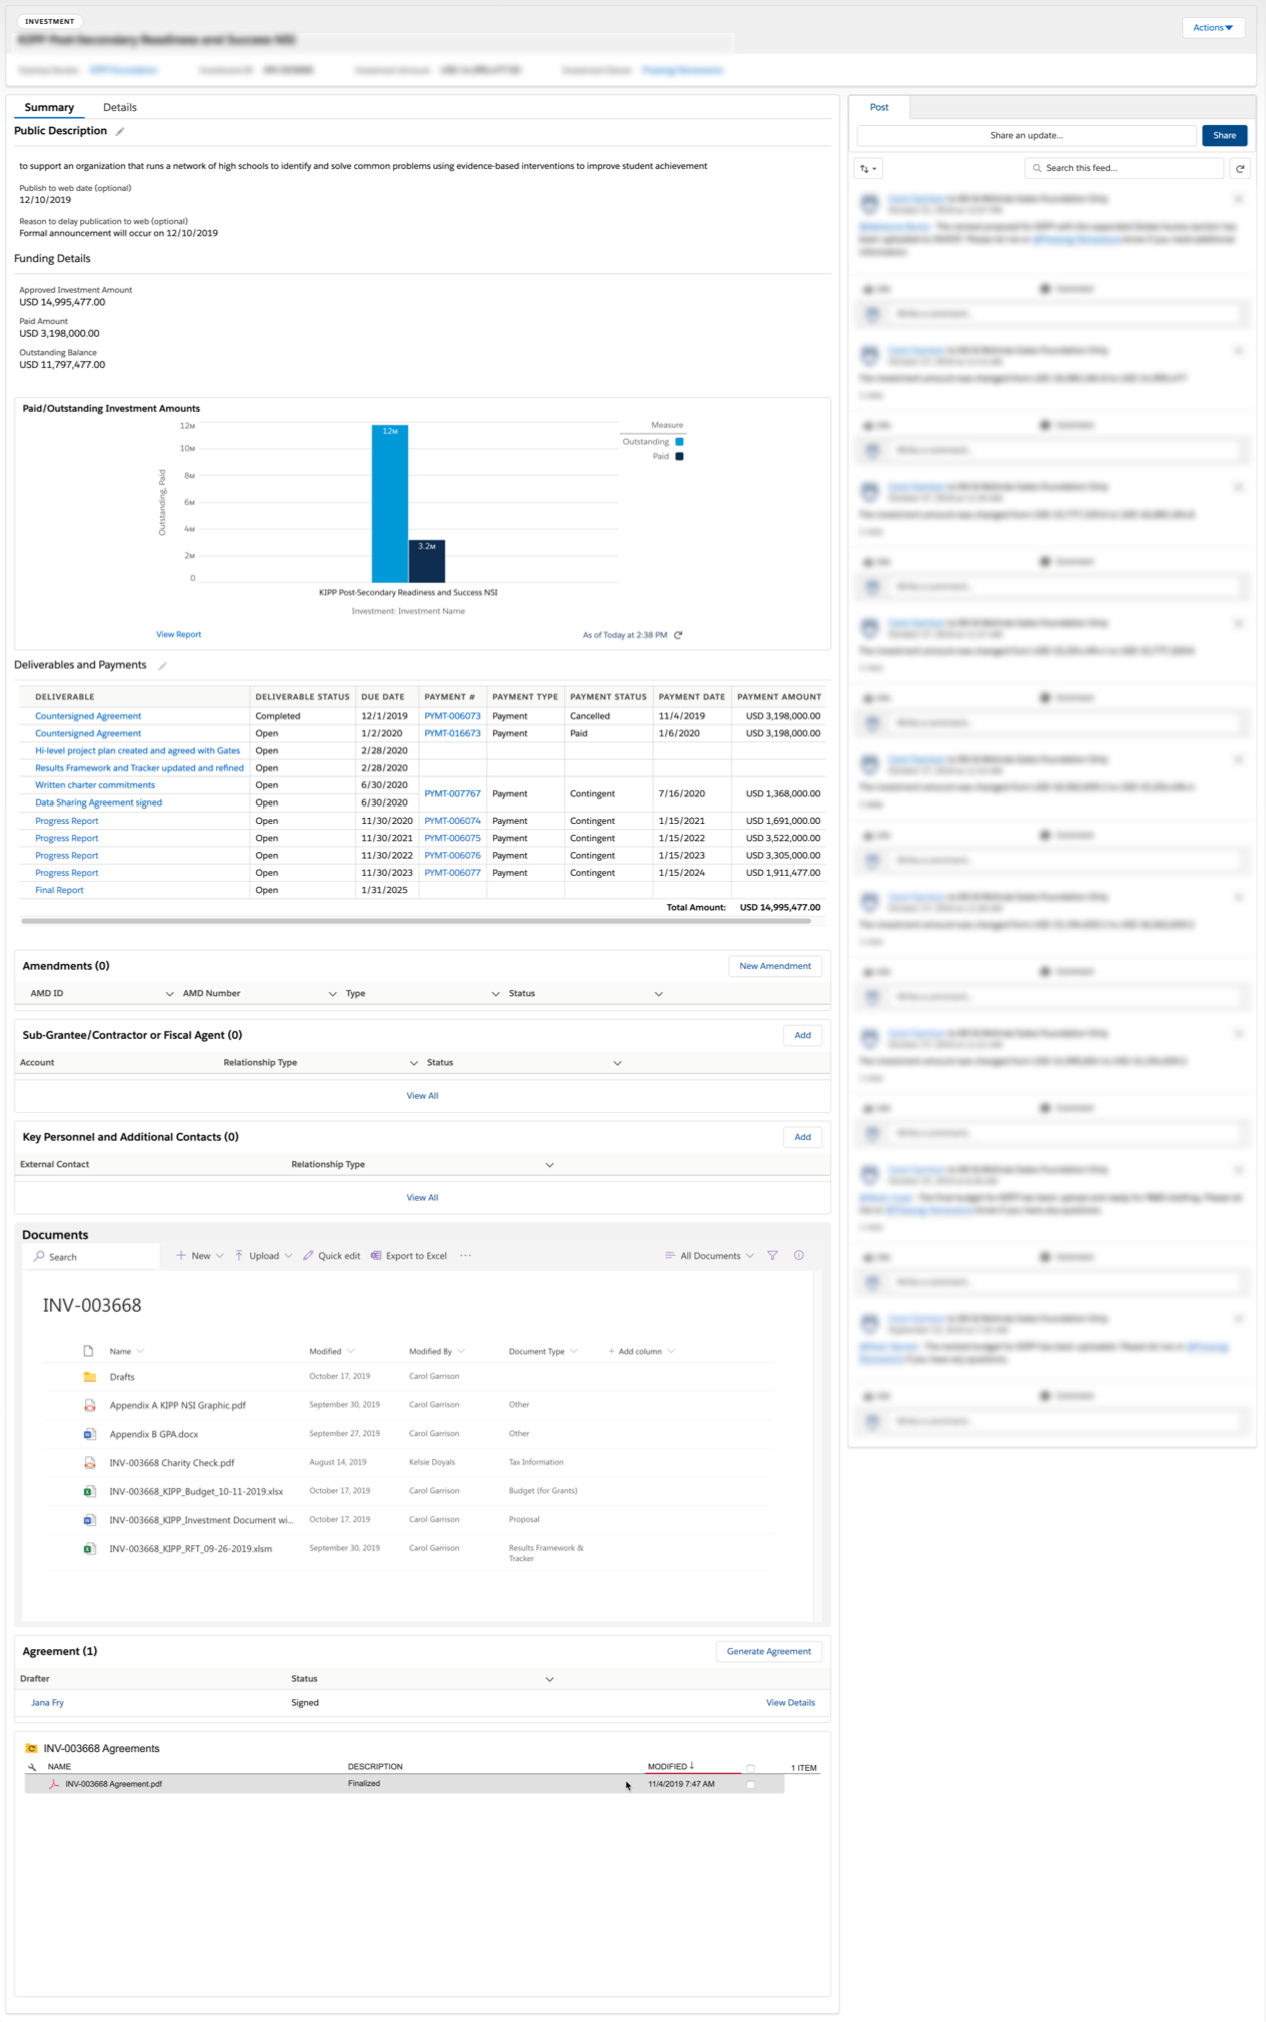
The payments graph is not helpful"
"There's no need to display material that was used to create the initial (in-process) investment"
"As with the in-process workflow, it's not necessary to display the workflow steps"
How this affects the experience
Having any information that is not immediately providing value runs the risk of being ignored and taking up valuable space.
Things I considered
- The UI is accommodating a lot of data that is not relevant to current activities, which in turn increases the time it takes to locate data that is relevant
- Ensure the system is more explicit in communicating upcoming events
- Reassess the problem the chart is trying to solve, and if it's valuable, consider an alternate design
My proposed design
These things are all about displaying information that isn't relevant or providing significant value per the amount of space its taking up in the UI. So, the easiest solution is to remove it or not include it in the first place. So, that's what I did.
I removed a chart that according to my research wasn't providing enough value in its current state. Material used in the creation of the investment is rarely referred to again once that investment becomes active. While creating an investment, the system displays workflow steps as a way of visually indicating progress. Since progress across investments is so variable, tracking progress in this way is not something that would be helpful or even possible.
The original design
User Feedback
The next step was to test the designs with at least six users with the goal of getting their feedback on two versions of the UI: a single-tab layout and a two-tab layout.
My hypotheses
- By adding a navigation menu––the user's ability to locate information would be greatly increased.
- Users would not notice that I removed a chart that seemed to provide limited value
- Placing financial data into same tab or within closer proximity would better serve findability as well as provide greater context for data analysis.
Proposed scenarios
- You want to know what needs to happen next for this investment. What would you do to determine this?
- If they do not refer to deliverables table, prompt them to view and explain what they are seeing in the table.
- Because of some personnel changes, this investment will be assigned to another investment owner. What would you do next to make this change?
- If cannot locate, prompt to locate "details"
- If click on 2nd tab, prompt them to locate on 1st tab
- You are following up on a conversation that you had with your grantee and want to reference something in the investment document. What would you do next to locate this info?
- If did not use jump links, prompt them to use another way to locate the info
- Someone asks you to verify something within diligence. What would you do next to find this info?
- You want to confirm values in the funding allocations for strategy. What would you do next?
To continue my self-led education of Figma, I decided to use it to create a clickable prototype that I planned to use to gather feedback.
Figma PrototypeConclusion
Because of other competing business priorities, the testing for this was put on hold. I know that my all my research, design ideas, and testing prep will serve the foundation well once this is re-prioritized.